Maintaining a low bowling average is particularly challenging in T20I cricket due to the aggressive batting styles and the shorter game format. The short format means that every ball counts and bowlers play a crucial role in determining the match’s outcome. Bowlers must be strategic and precise, as even a single over can change the game’s momentum.
The bowling average is a crucial metric in cricket that measures a bowler’s effectiveness. It is calculated by dividing the total number of runs conceded by the number of wickets taken. A lower average indicates better performance, as the bowler gives away fewer runs per wicket.
We’ll discuss the top 10 worst career bowling average records for T20I matches, their stats, performance, and the factors contributing to their challenging careers.
Read Also: Top 10 Longest Sixes In Cricket History
Top 10 Worst Career Bowling Average Records For T20I Matches: An Overview
Several factors can impact a bowler’s average, including pitch conditions, the quality of opposition, personal form, and team strategy. Injuries and inconsistent performances also play a crucial role.
To identify the worst bowling averages, we look at players who have played many matches and have consistently struggled to keep their averages low. Factors like total runs conceded, wickets taken, and economy rates are considered. Here are the top 10 worst career bowling average records for T20I matches.
- James Franklin (NZ)
- Chamika Karunaratne (SL)
- Syed Aziz (MAS)
- Naseem Shah (PAK)
- Tim Bresnan (ENG)
- Bilal Arora (MLT)
- Mashrafe Mortaza (BAN)
- Amar Sharma (MLT)
- Louis Bruce (GIBR)
- Mohammad Hasnain (PAK)
| Player | Span | Mat | Inns | Overs | Runs | Wkts | BBI | Ave | Econ | SR |
|---|---|---|---|---|---|---|---|---|---|---|
| JDP Oram (NZ) | 2005-2012 | 36 | 32 | 91.0 | 793 | 19 | 3/33 | 41.73 | 8.71 | 28.73 |
| C Karunaratne (SL) | 2021-2023 | 42 | 39 | 113.5 | 953 | 24 | 2/22 | 39.70 | 8.37 | 28.45 |
| Syed Aziz (MAS) | 2019-2024 | 80 | 33 | 88.1 | 741 | 19 | 2/4 | 39.00 | 8.40 | 27.84 |
| Naseem Shah (PAK) | 2022-2024 | 25 | 24 | 90.1 | 715 | 19 | 2/7 | 37.63 | 7.92 | 28.47 |
| TT Bresnan (ENG) | 2006-2014 | 34 | 34 | 110.3 | 887 | 24 | 3/10 | 36.95 | 8.02 | 27.62 |
| B Arora (MLT) | 2019-2024 | 52 | 43 | 113.3 | 913 | 25 | 3/20 | 36.52 | 8.04 | 27.24 |
| Mashrafe Mortaza (BAN) | 2006-2017 | 54 | 53 | 189.5 | 1527 | 42 | 4/19 | 36.35 | 8.04 | 27.11 |
| Amar Sharma (MLT) | 2020-2023 | 36 | 35 | 120.3 | 952 | 27 | 3/23 | 35.25 | 7.90 | 26.77 |
| L Bruce (GIBR) | 2021-2024 | 36 | 31 | 94.2 | 740 | 21 | 4/13 | 35.23 | 7.84 | 26.95 |
| Mohammad Hasnain (PAK) | 2019-2022 | 27 | 26 | 101.0 | 853 | 25 | 3/37 | 34.12 | 8.44 | 24.24 |
Read Also: Top 10 Best Fielders In Cricket History
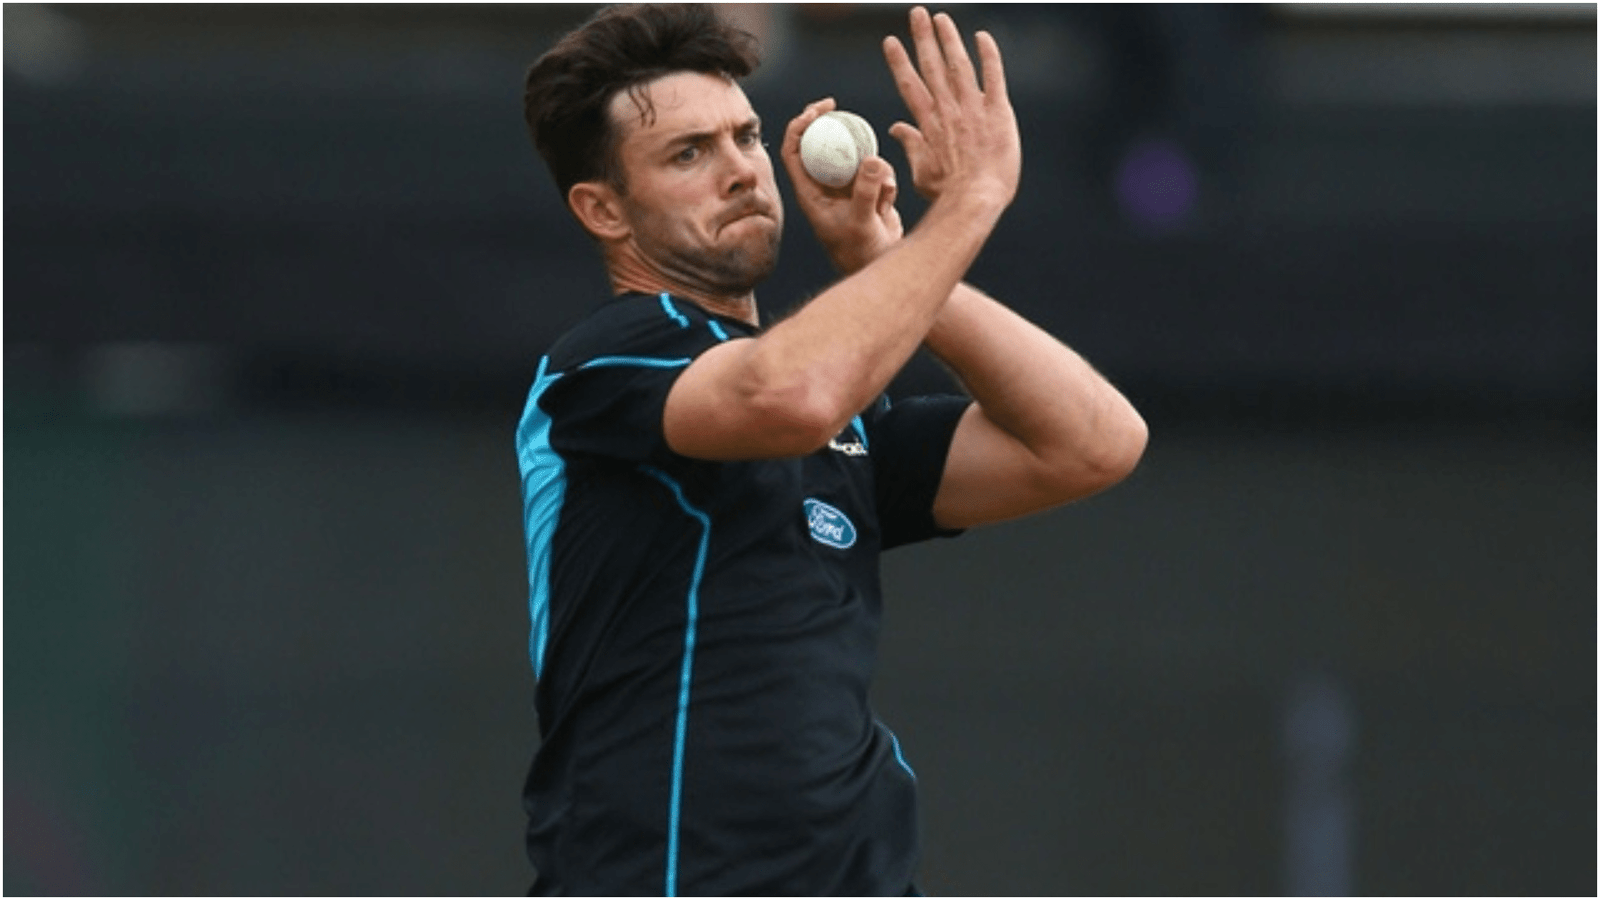
1. James Franklin (NZ)
James Franklin, a versatile player for New Zealand, played T20I cricket from 2005 to 2012. He participated in 36 matches, bowling in 32 innings throughout his career. He bowled 91 overs, conceding 793 runs and taking only 19 wickets.
His best bowling figures in a match were 3/33. This performance led to a bowling average of 41.73, an economy rate of 8.71, and a strike rate of 28.73. Franklin’s high economy rate and fewer wickets contributed to a higher bowling average, reflecting his challenges in maintaining consistency in the game’s shortest format.
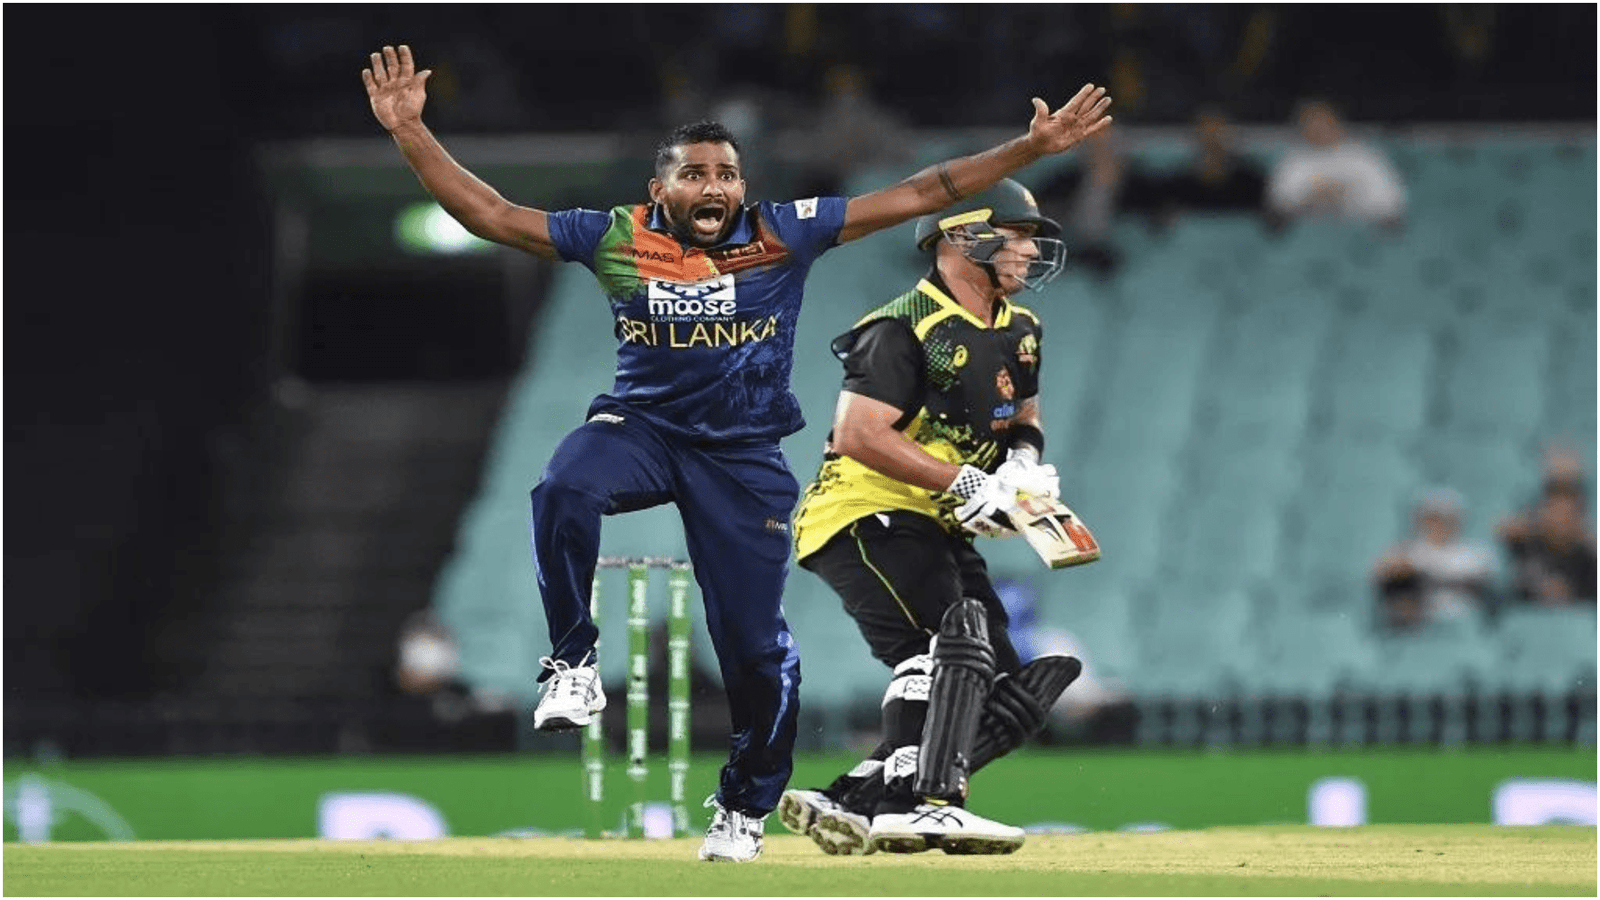
2. Chamika Karunaratne (SL)
Chamika Karunaratne’s T20I career from 2021 to 2023 highlights his difficulties in maintaining a competitive bowling average. Over this period, he played in 42 matches and bowled in 39 innings.
He bowled 113.5 overs, conceding 953 runs and taking 24 wickets. His best bowling figures in an innings were 2/22. Karunaratne ended up with a bowling average of 39.70, an economy rate of 8.37, and a strike rate of 28.45.
Despite showing potential, his inability to consistently secure wickets and keep the runs down impacted his overall statistics.
3. Syed Aziz (MAS)
Syed Aziz, representing Malaysia, has had a challenging T20I career from 2019 to 2024. He played in 80 matches and bowled in 33 innings during this time. He bowled 88.1 overs, conceding 741 runs and taking 19 wickets.
His best bowling performance in an innings was 2/4. Aziz’s bowling average is 39.00, with an economy rate of 8.40 and a strike rate of 27.84. His high average reflects his difficulty securing wickets and controlling the run flow, underscoring the competitive nature of international T20 cricket.
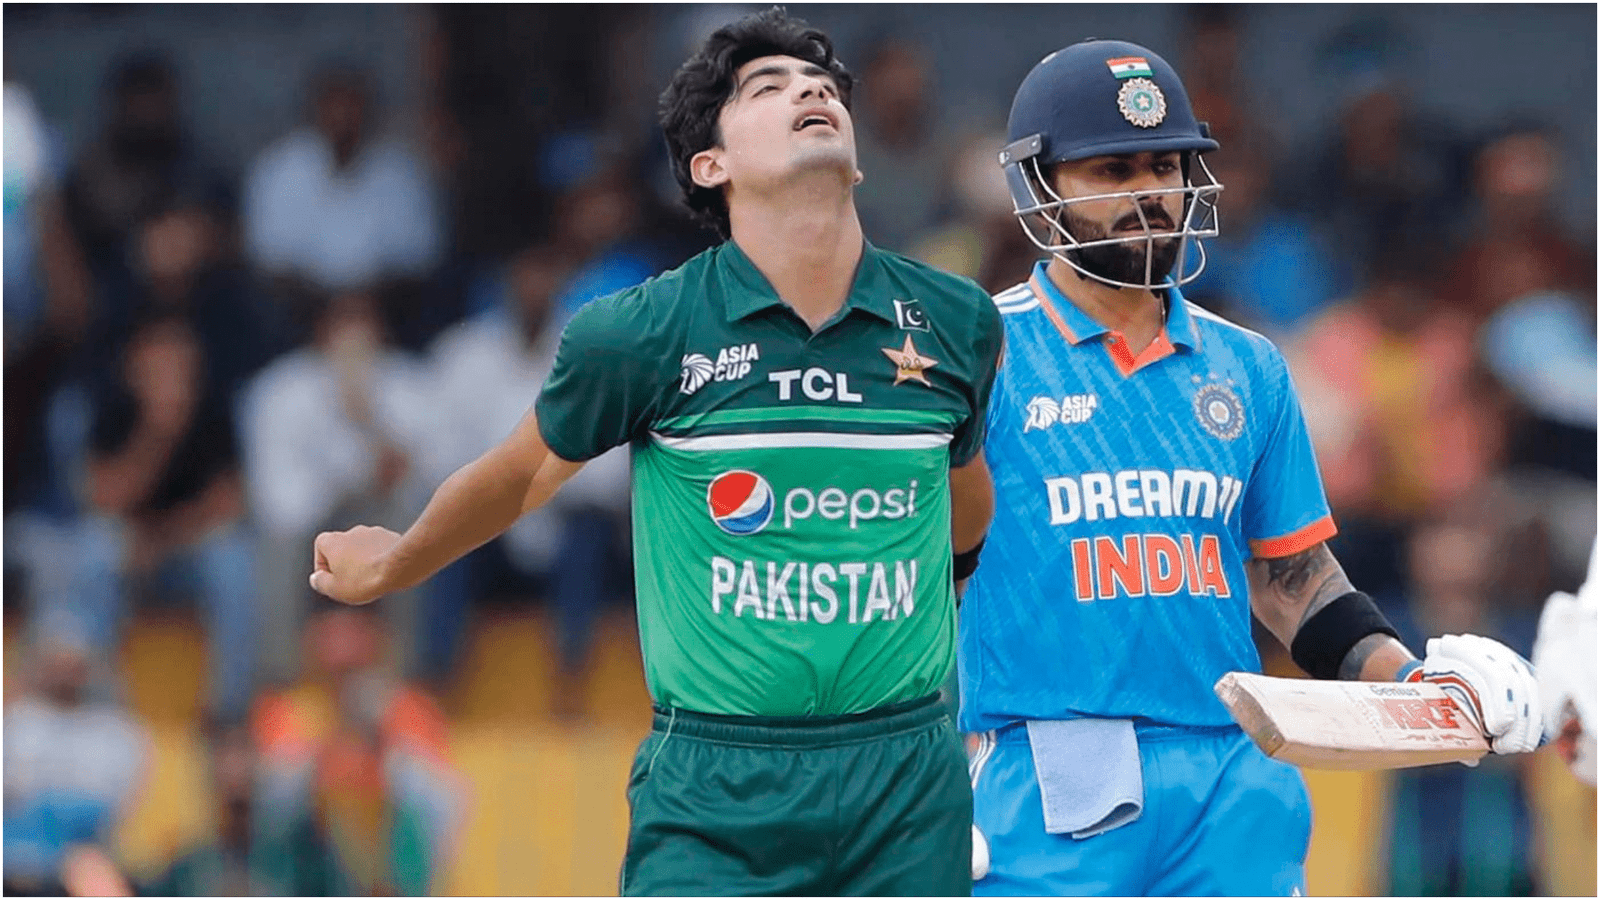
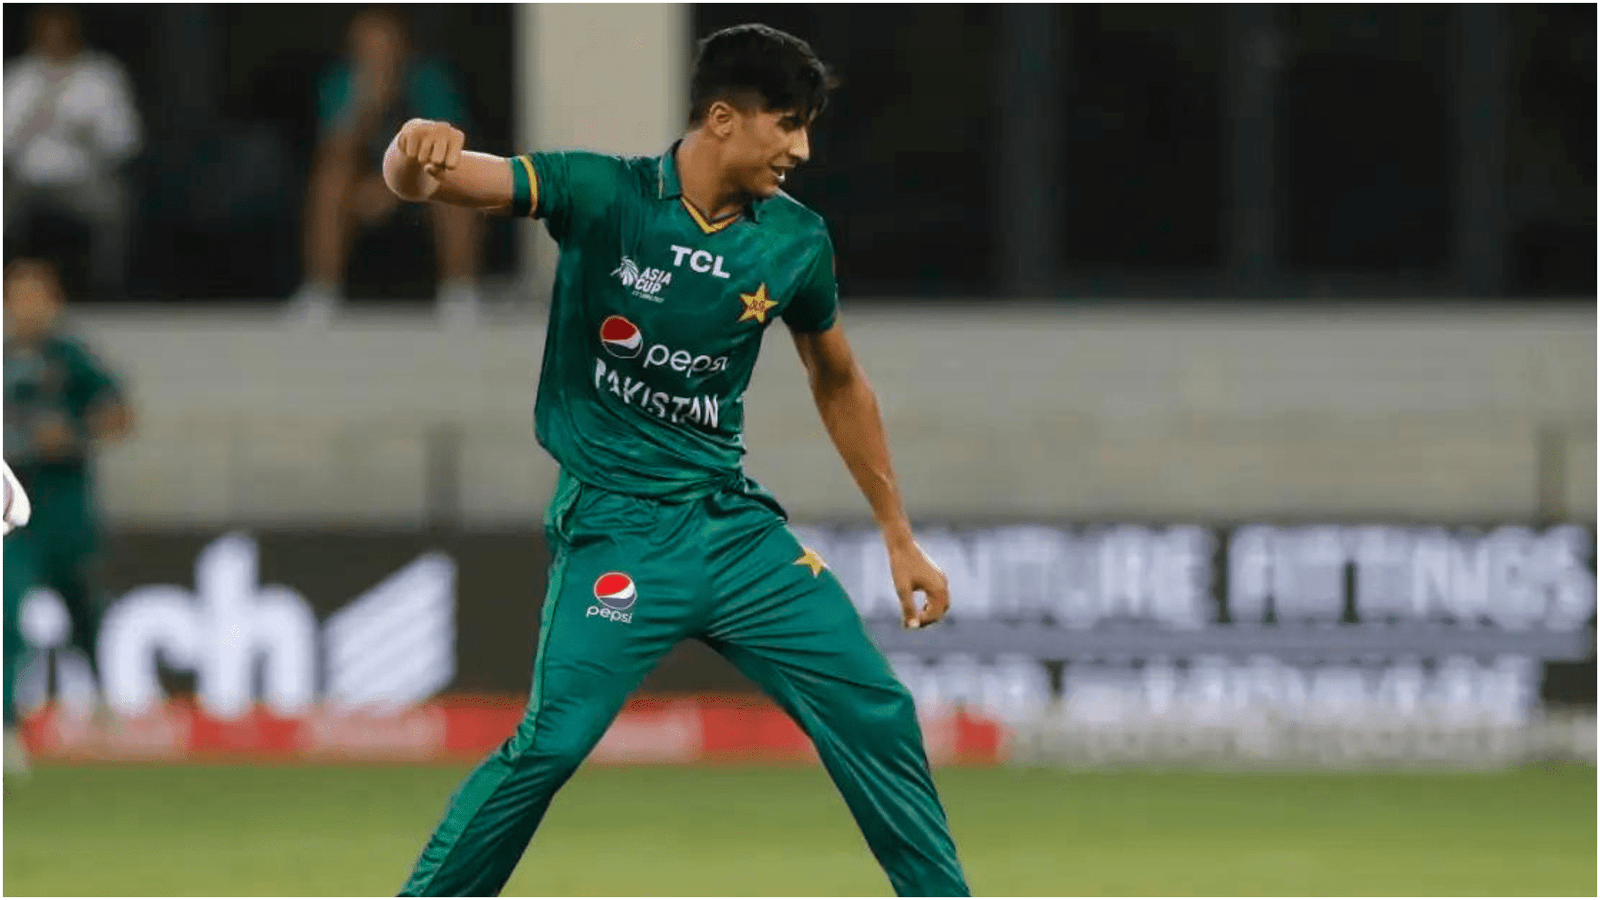
4. Naseem Shah (PAK)
Naseem Shah, known for his pace, had a mixed T20I career from 2022 to 2024. Over these years, he played in 25 matches and bowled in 24 innings. He delivered 90.1 overs, conceding 715 runs and taking 19 wickets. His best bowling figures were 2/7.
Shah’s bowling average is 37.63, with an economy rate of 7.92 and a strike rate of 28.47. Despite his speed and potential, his inconsistency in taking wickets has led to a higher bowling average, highlighting his challenges in adapting to the T20I format.
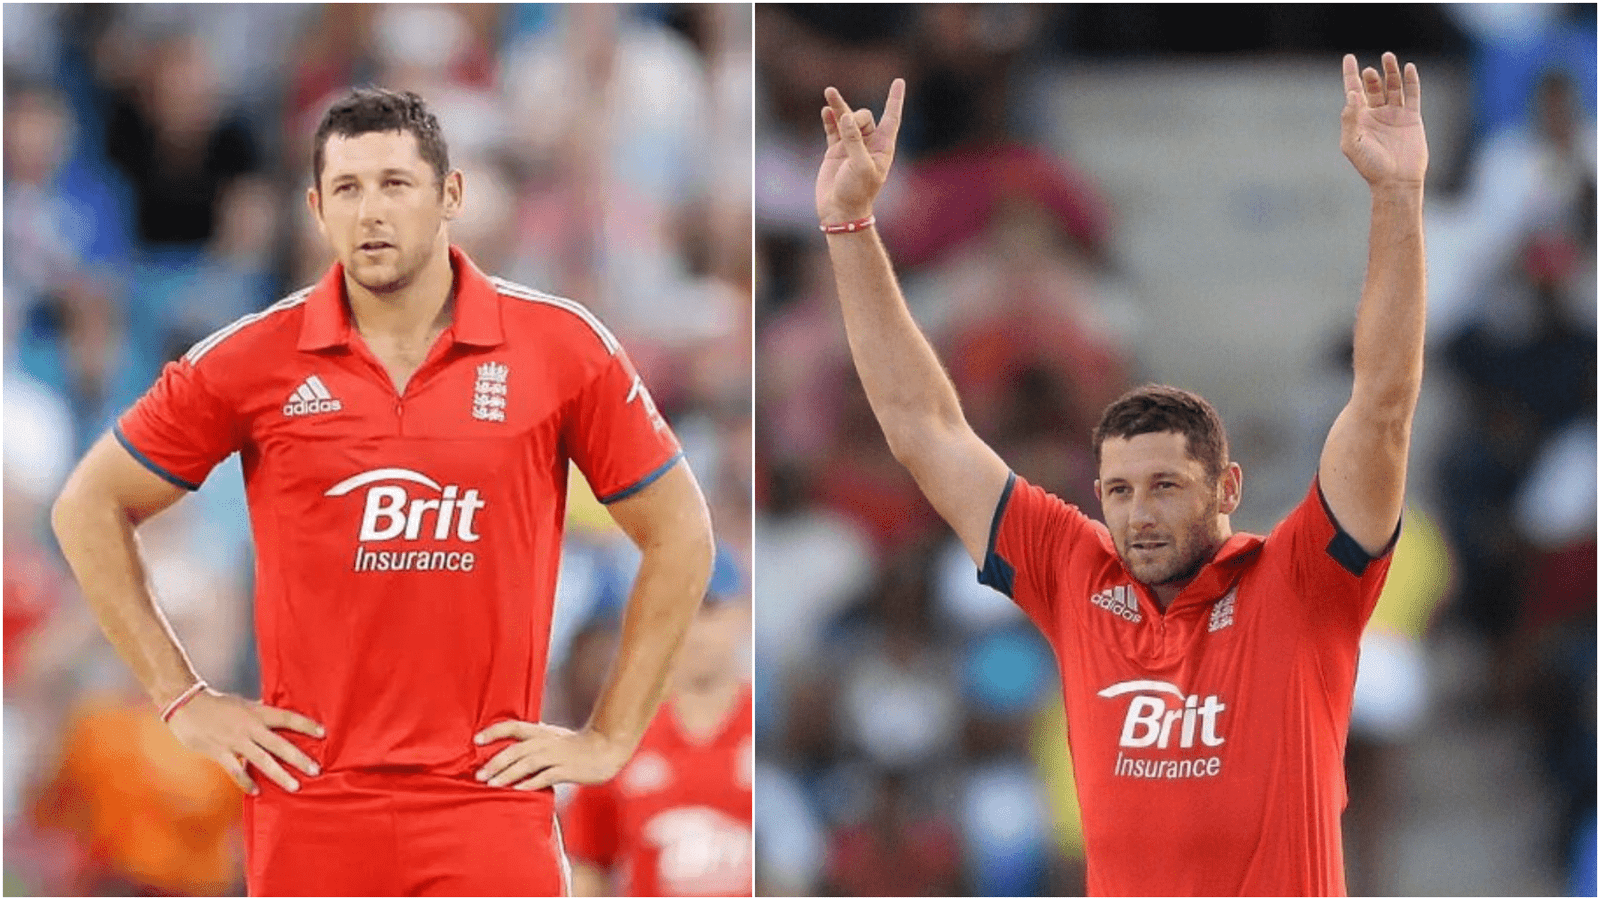
5. Tim Bresnan (ENG)
Tim Bresnan, a reliable bowler for England, faced challenges in T20Is from 2006 to 2014. He participated in 34 matches, bowling in all of them. He bowled 110.3 overs, conceding 887 runs and taking 24 wickets. His best bowling figures were 3/10.
Bresnan’s bowling average was 36.95, with an economy rate of 8.02 and a strike rate of 27.62. Despite some standout performances, his overall career in T20Is was marked by periods of inconsistency, leading to a higher bowling average.
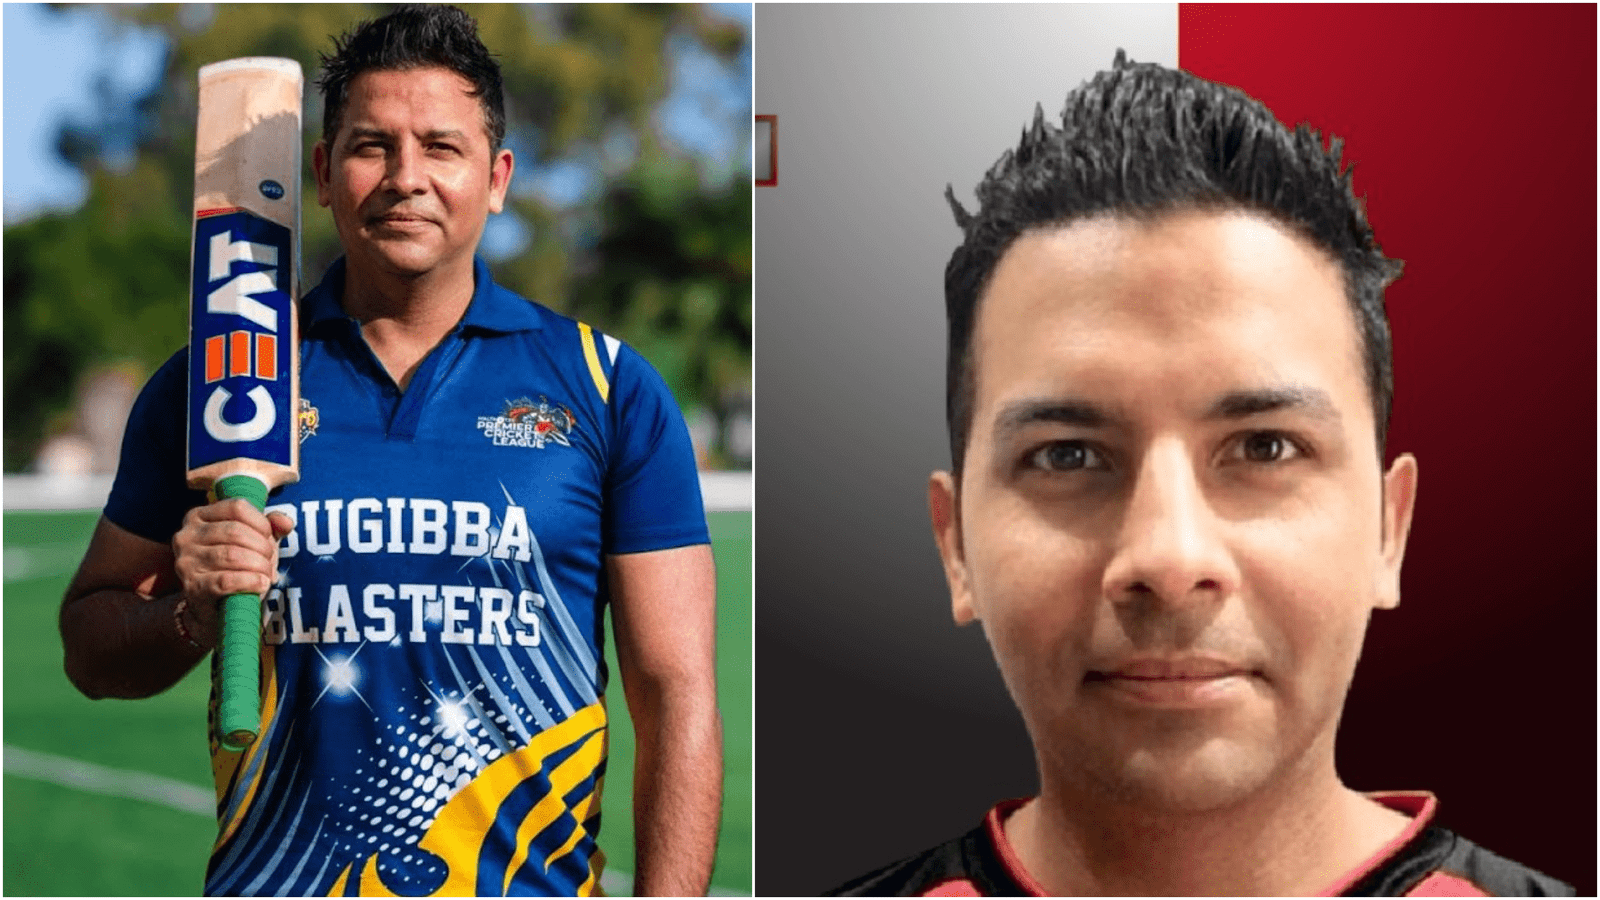
6. Bilal Arora (MLT)
Bilal Arora’s career for Malta from 2019 to 2024 showcases the difficulties bowlers from smaller cricketing nations face. He played in 52 matches during this period and bowled in 43 innings. He delivered 113.3 overs, conceding 913 runs and taking 25 wickets.
His best bowling figures were 3/20. Arora’s bowling average is 36.52, with an economy rate of 8.04 and a strike rate of 27.24. His high average is a testament to his tough competition and struggles in containing runs.
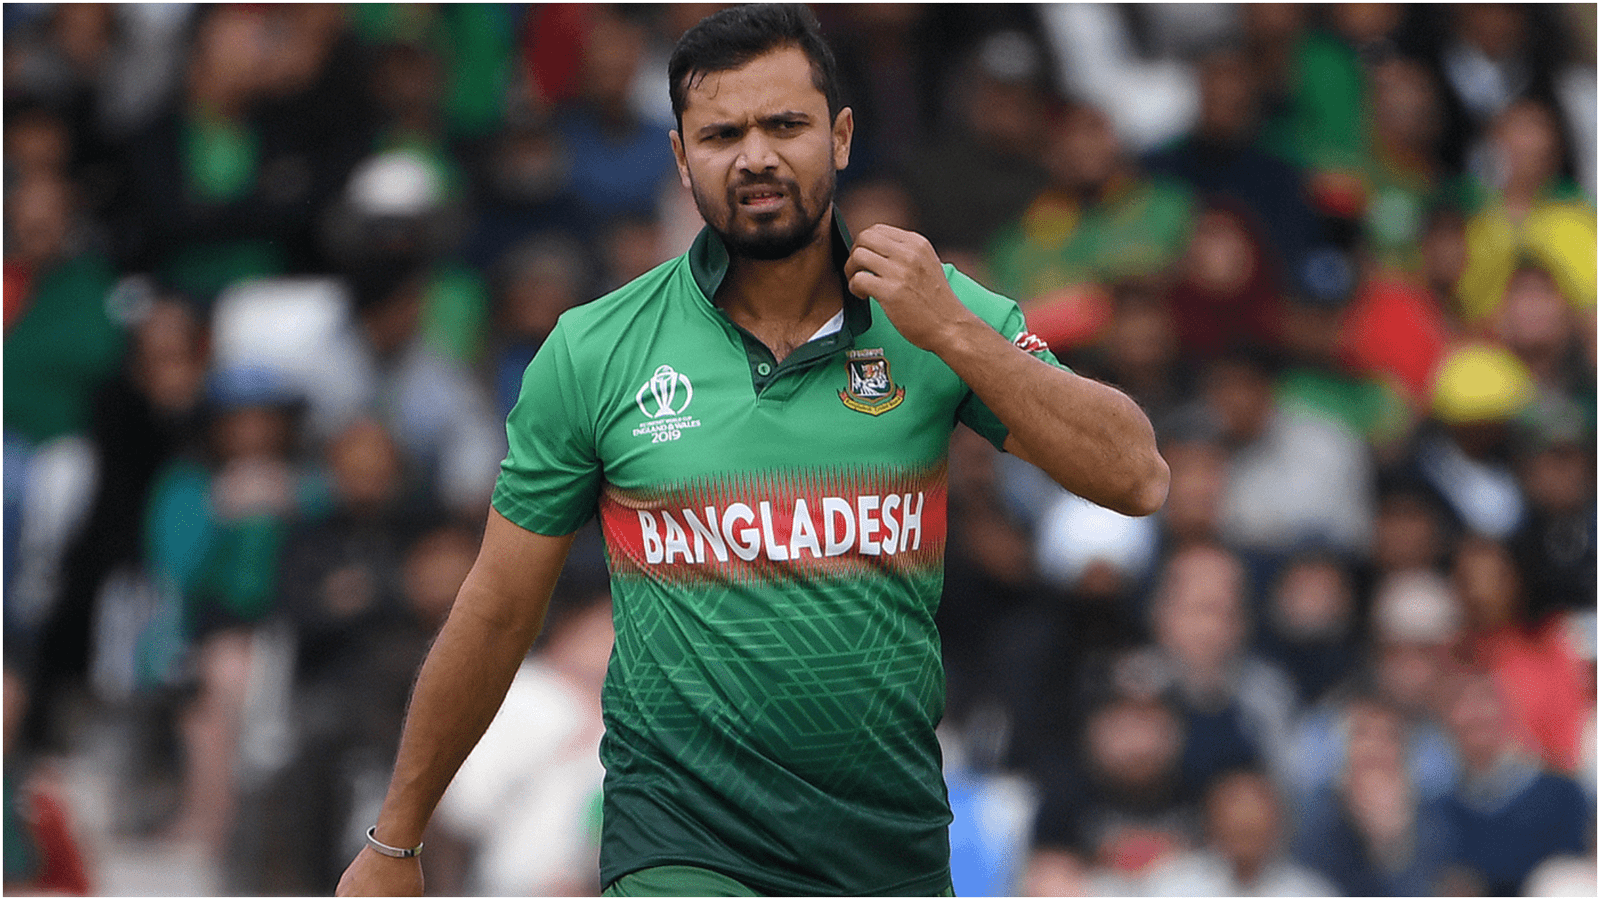
7. Mashrafe Mortaza (BAN)
Mashrafe Mortaza, a veteran of Bangladesh, had a T20I career spanning from 2006 to 2017. He played in 54 matches, bowling in 53 innings. He bowled 189.5 overs, conceding 1527 runs and taking 42 wickets. His best bowling figures were 4/19.
Mortaza’s bowling average was 36.35, with an economy rate of 8.04 and a strike rate of 27.11. Despite being a key player for Bangladesh, his high bowling average reflects his challenges in the T20 format, particularly in maintaining control and taking wickets consistently.
8. Amar Sharma (MLT)
Amar Sharma, representing Malta, had a challenging T20I career from 2020 to 2023. He played in 36 matches and bowled in 35 innings during this period. He delivered 120.3 overs, conceding 952 runs and taking 27 wickets.
His best bowling performance was 3/23. Sharma’s bowling average is 35.25, with an economy rate of 7.90 and a strike rate of 26.77. His career highlights the struggles of bowlers from emerging cricket nations, facing tough competition and working to establish themselves on the international stage.
9. Louis Bruce (GIBR)
Louis Bruce, a bowler for Gibraltar, has had a challenging T20I career from 2021 to 2024. Over these years, he played in 36 matches, bowling in 31 innings. He bowled 94.2 overs, conceding 740 runs and taking 21 wickets.
His best bowling figures were 4/13. Bruce’s bowling average is 35.23, with an economy rate of 7.84 and a strike rate of 26.95. Despite some notable performances, his overall statistics reflect his difficulties maintaining consistency and effectiveness in T20Is.
10. Mohammad Hasnain (PAK)
Mohammad Hasnain, another fast bowler from Pakistan, played T20Is from 2019 to 2022. He played in 27 matches, bowling in 26 innings. He delivered 101 overs, conceding 853 runs and taking 25 wickets.
His best bowling figures were 3/37. Hasnain’s bowling average is 34.12, with an economy rate of 8.44 and a strike rate of 24.24. Despite his pace and potential, his high economy rate and inconsistency in taking wickets have resulted in a higher bowling average.
Read Also: Top 10 Wicket Keepers in World Cricket
Factors Contributing To Poor Bowling Averages
There are several reasons why bowlers might have poor bowling averages in T20I cricket.
- Firstly, pitch conditions can heavily influence a bowler’s performance. Some pitches are more batsman-friendly, making it challenging for bowlers to keep their averages low.
- The quality of the opposition also plays a significant role. Facing strong batters who capitalize on any mistake can inflate a bowler’s average.
- Additionally, a bowler’s form and fitness are crucial. Injuries, lack of match practice, or simply being out of form can all contribute to higher averages.
- Team strategy is another factor. Bowlers given challenging roles, like bowling during powerplays or at the death overs, often have higher averages due to the aggressive batting during those periods.
Impact on Teams
High bowling averages can hurt a team’s performance in T20Is. Bowlers giving away runs quickly can pressure their team’s batting to chase big targets or set challenging ones.
In matches involving these bowlers, we often see crucial moments where their inability to contain runs or take wickets swings momentum in favor of the opposition.
Strategies for Improvement
Improving bowling averages requires a mix of physical and mental strategies. Targeted training and coaching can help bowlers work on weaknesses while staying fit reduces injury risks and ensures consistent performance.
Bowlers need mental toughness and confidence to handle T20 pressure. Tactical changes, like varying bowling speeds or adapting to different pitch conditions, can also help.
Conclusion
Given the format’s aggressive nature, keeping a low bowling average in T20I cricket is tough. The players we’ve examined face challenges that contribute to their high averages.
Understanding these challenges gives insight into the complexities of T20 cricket and the constant battle bowlers face to stay competitive. While these statistics highlight difficulties, they also showcase the resilience and dedication needed to play internationally.
FAQs
Q1. What is considered a good bowling average in T20I cricket?
Ans: A good bowling average in T20I cricket is typically below 25, indicating effective wicket-taking while conceding fewer runs.
Q2. How can a bowler improve their bowling average?
Ans: A bowler can improve their bowling average through rigorous training, maintaining fitness, focusing on consistency, and adapting to different match situations.
Q3. Are there any famous bowlers with poor career averages but successful careers?
Ans: Some famous bowlers have had poor career averages but contributed significantly to their teams in other formats or had impactful individual performances.
Q4. What role does a bowler’s economy rate play in T20I cricket?
Ans: A bowler’s economy rate is crucial in T20I cricket as it measures runs conceded per over, reflecting their ability to contain the opposition’s scoring.
Q5. How does team strategy affect individual bowling averages?
Ans: Team strategy, including bowling positions, match conditions, and specific roles assigned to bowlers, can significantly influence individual bowling averages.


